Benchmark plot creation time. Broken down into construct, build, render and draw times.
Source:R/bench.R
benchplot.RdBenchmark plot creation time. Broken down into construct, build, render and draw times.
Examples
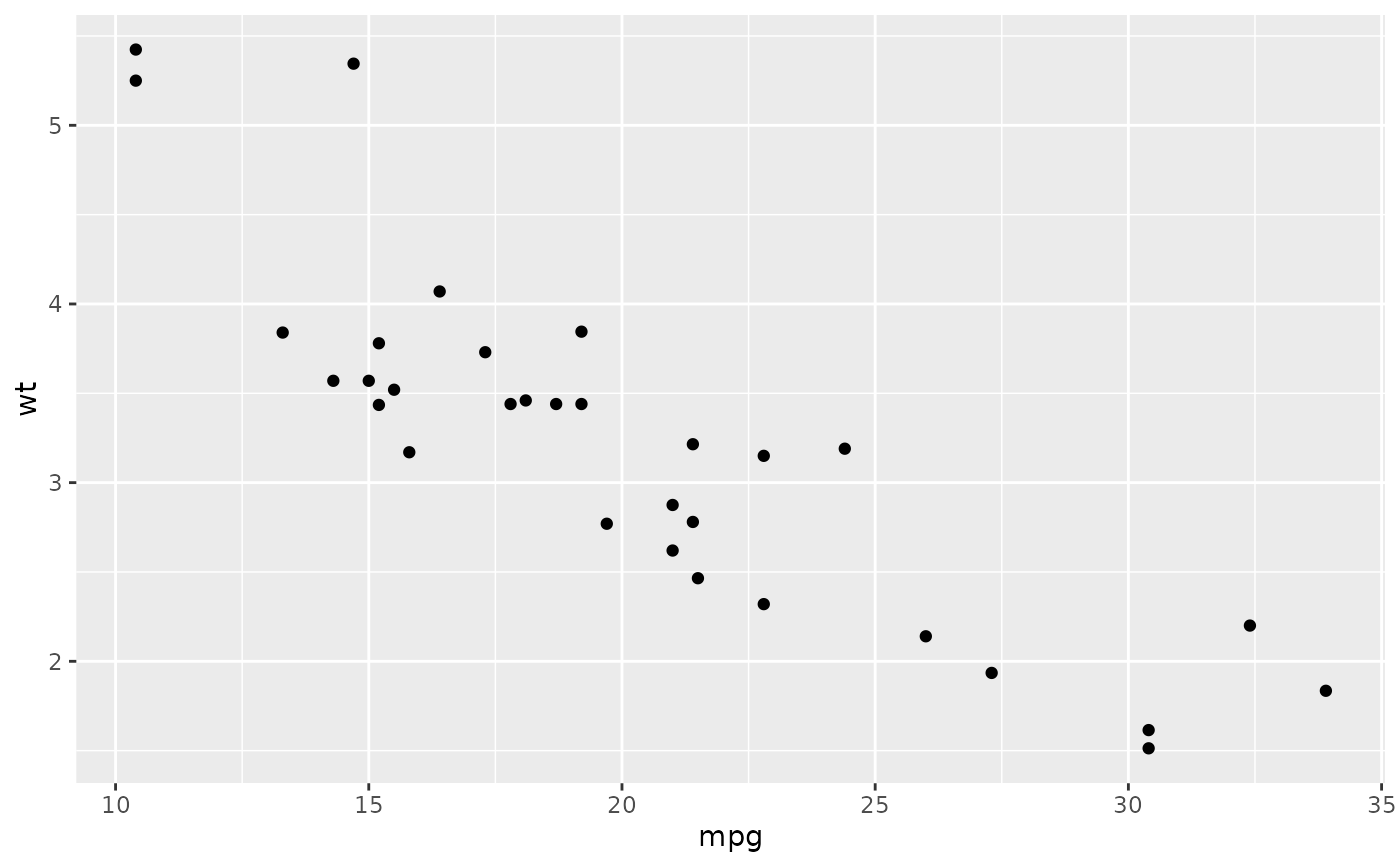
benchplot(ggplot(mtcars, aes(mpg, wt)) + geom_point())
#>        step user.self sys.self elapsed
#> 1 construct     0.002    0.001   0.003
#> 2     build     0.019    0.000   0.019
#> 3    render     0.019    0.000   0.018
#> 4      draw     0.019    0.000   0.018
#> 5     TOTAL     0.059    0.001   0.058
benchplot(ggplot(mtcars, aes(mpg, wt)) + geom_point() + facet_grid(. ~ cyl))
#>        step user.self sys.self elapsed
#> 1 construct     0.002        0   0.003
#> 2     build     0.037        0   0.036
#> 3    render     0.042        0   0.041
#> 4      draw     0.034        0   0.033
#> 5     TOTAL     0.115        0   0.113

# With tidy eval:
p <- expr(ggplot(mtcars, aes(mpg, wt)) + geom_point())
benchplot(!!p)

#>        step user.self sys.self elapsed
#> 1 construct     0.002        0   0.003
#> 2     build     0.017        0   0.018
#> 3    render     0.019        0   0.018
#> 4      draw     0.018        0   0.019
#> 5     TOTAL     0.056        0   0.058
#> step user.self sys.self elapsed
#> 1 construct 0.002 0 0.003
#> 2 build 0.017 0 0.018
#> 3 render 0.019 0 0.018
#> 4 draw 0.018 0 0.019
#> 5 TOTAL 0.056 0 0.058