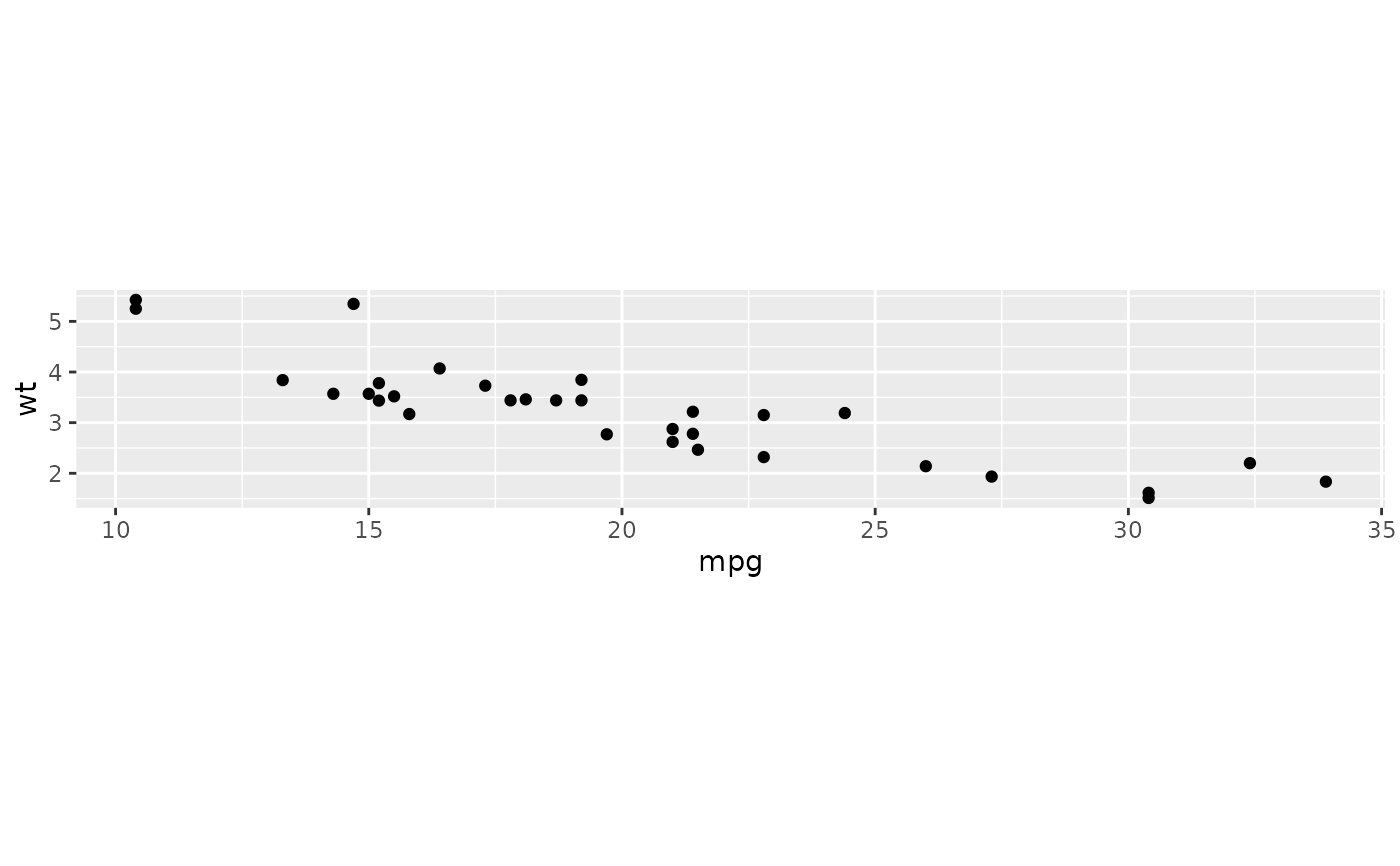
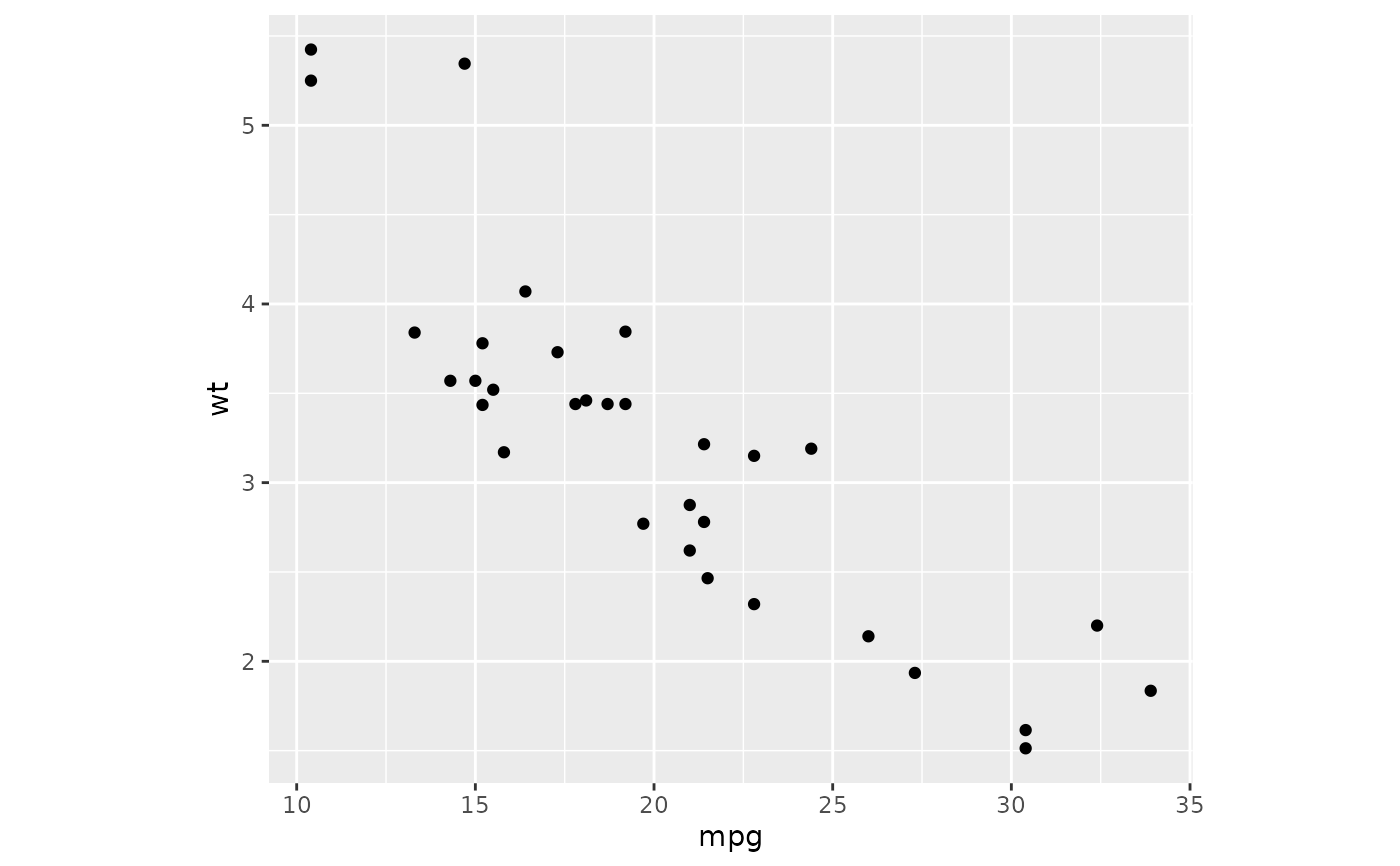
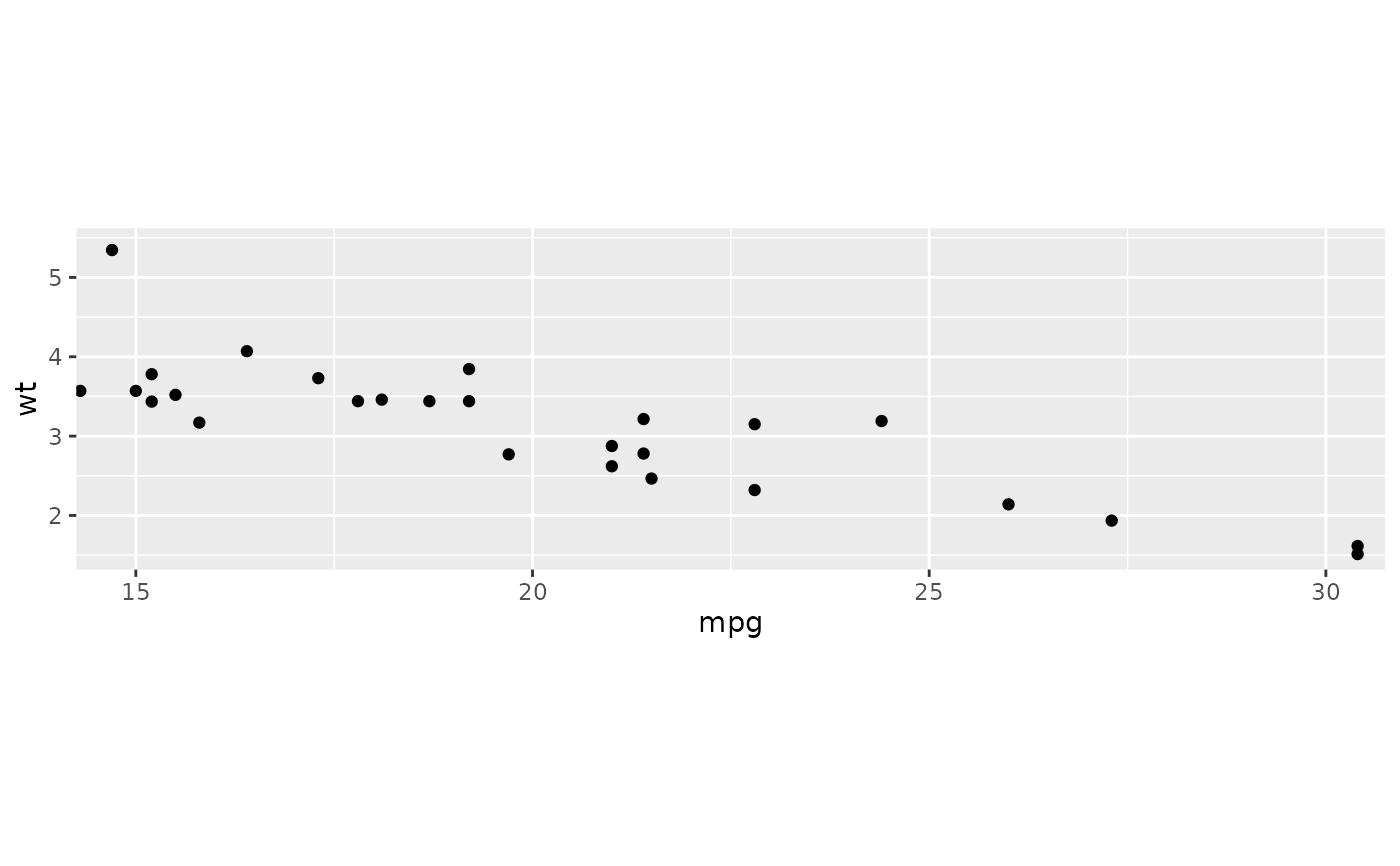
A fixed scale coordinate system forces a specified ratio between the
physical representation of data units on the axes. The ratio represents the
number of units on the y-axis equivalent to one unit on the x-axis. The
default, ratio = 1, ensures that one unit on the x-axis is the same
length as one unit on the y-axis. Ratios higher than one make units on the
y axis longer than units on the x-axis, and vice versa. This is similar to
MASS::eqscplot(), but it works for all types of graphics.
Arguments
- ratio
aspect ratio, expressed as
y / x- xlim, ylim
Limits for the x and y axes.
- expand
If
TRUE, the default, adds a small expansion factor to the limits to ensure that data and axes don't overlap. IfFALSE, limits are taken exactly from the data orxlim/ylim.- clip
Should drawing be clipped to the extent of the plot panel? A setting of
"on"(the default) means yes, and a setting of"off"means no. In most cases, the default of"on"should not be changed, as settingclip = "off"can cause unexpected results. It allows drawing of data points anywhere on the plot, including in the plot margins. If limits are set viaxlimandylimand some data points fall outside those limits, then those data points may show up in places such as the axes, the legend, the plot title, or the plot margins.
Examples
# ensures that the ranges of axes are equal to the specified ratio by
# adjusting the plot aspect ratio

p <- ggplot(mtcars, aes(mpg, wt)) + geom_point()
p + coord_fixed(ratio = 1)

p + coord_fixed(ratio = 5)

p + coord_fixed(ratio = 1/5)

p + coord_fixed(xlim = c(15, 30))


# Resize the plot to see that the specified aspect ratio is maintained
